
In order to solve performance issues, you must learn how to profile and monitor an application. How to do that using Google Chrome developer tools?

Table of Contents
How to start a recording
- Open the chrome browser with any website.
- Hit F12 OR right click on the screen and select “inspect element”
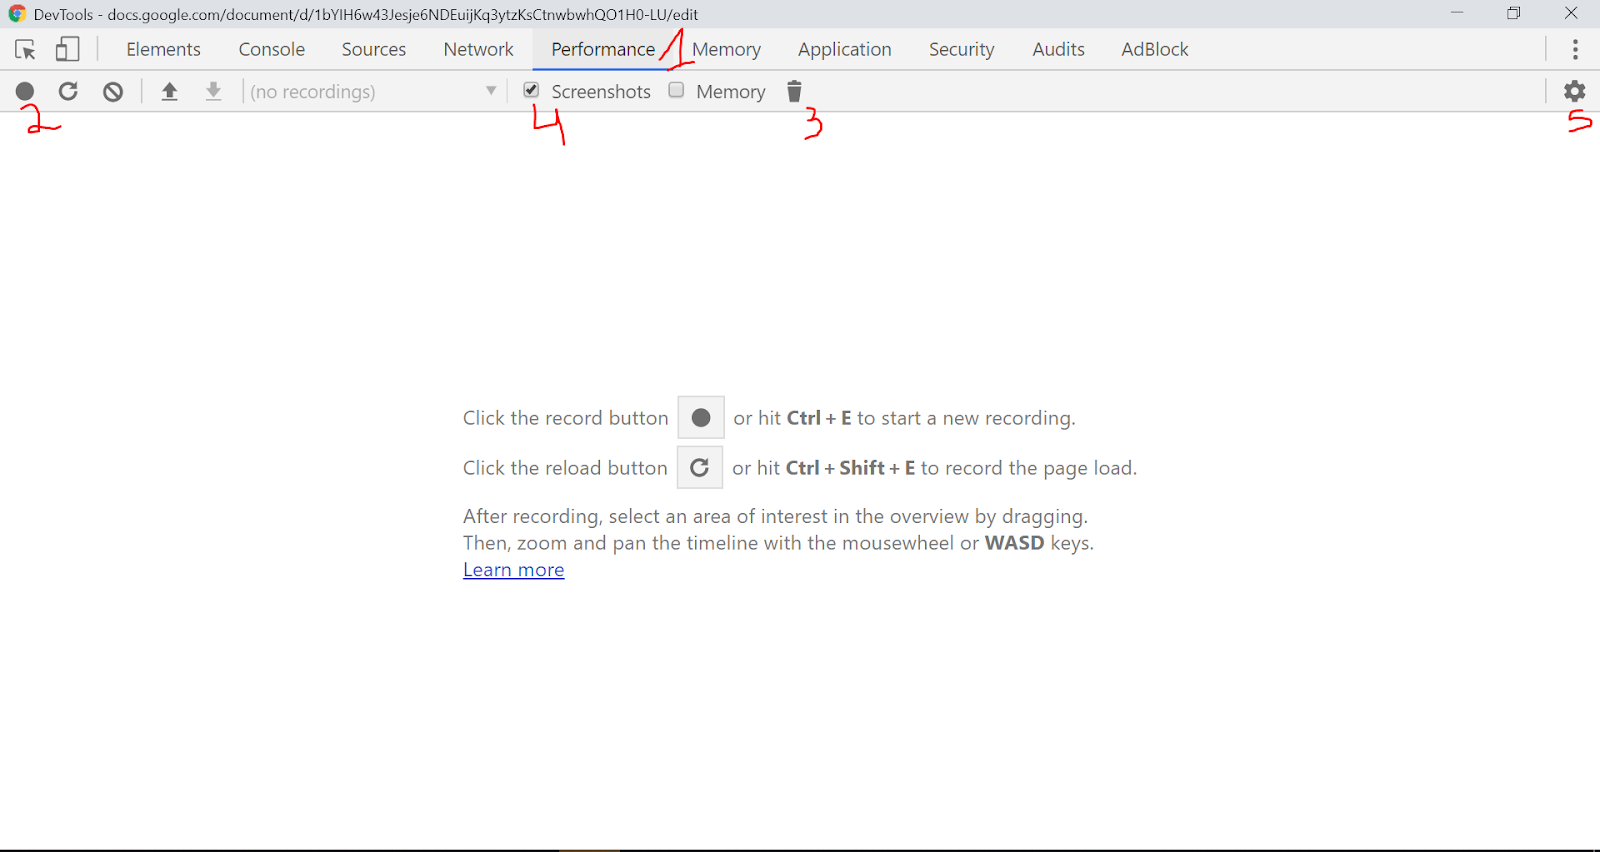
- In the dev tools screen that opens, select the “Performance” tab (1 in Figure 1)
- Click the “record” button (2 in the Figure 1)
Now the app is being recorded.
What are Performance Recording Settings
Button 3 in Figure 1 forces garbage collection. If you don’t know what it is, don’t worry – we’ll go over it later on.
Number 4 in Figure 1 (the checkbox) denotes whether the performance tool should take snapshots during the run. This can be removed for better performance, but cannot be done after the recording was taken, so plan ahead.
Now that all is set up, we can click the record button. Your performance tab will look like Figure 2.

During the recording, nothing exciting happens on screen. This is the time for you to play around with your application or reproduce a scenario that you know or assume causes a performance issue.
Once you are done, click on the “Stop” button to stop the recording. You will now see the recording’s result.
How to Read Performance Recording Results?
Now you have a recording result. This is the basic monitoring of the app’s runtime. Here you can see EVERYTHING that happened during the run.

Figure 3: Recording results screen.
The results of the recording are shown in Figure 3. This might seem overwhelming when you view this screen for the first time. There is a lot of information in this window and we will go over its parts to clarify.
The Performance Profile Timeline

Figure 4: The results’ timeline
The timeline shows you a birds-eye view of what happened in the app.
The top part shows the Critical Rendering Path parts (Javascript, style, layout, paint and composite) as well as user interactions, ajax calls etc.
The middle part, which exists only when you check the “Screenshot” option, is the actual screenshots taken during the recording. This can help you if you wish to examine things that happen in accordance to visual state of the application.
The bottom part shows you memory trends of the application. In this example, you can see the memory rises and after a while it drops. This is common for games that have a rendering engine. The memory rises until a garbage collection process occurs.
The Performance Profile Flamechart

This is the most overwhelming part in the performance tool – by far. In Figure 5, all of the data is folded.
You can unfold Frames, Interactions, the main thread and more.
The most useful part for debugging performance issues (and debugging in general) is the Main part (Figure 6). We will use other parts at times, but since this is the most useful tool, let’s see an example of what it gives you.

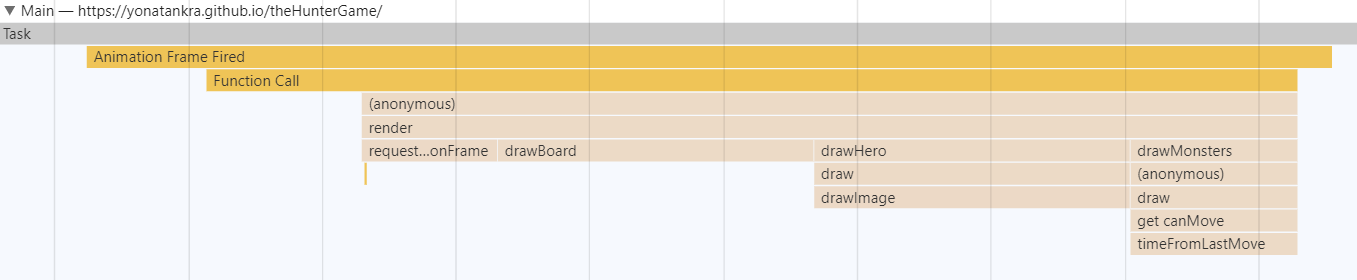
All of the yellow parts indicate javascript running. You can zoom in on any part of the flame chart to see more details – and actually search for function names (just hit ctrl/cmnd + f to open the search box).
This way, you can quickly see what is the overall time of the frame and what functions made the most impact lengthening it.
The Performance Profile Memory Area
Below the flame chart, there’s another chart (Figure 7). DOM nodes and other assets that can accumulate over time.

The blue part is memory, red is document, green is DOM nodes, yellow is listeners and purple is GPU memory. This part shows you trends in your app and can be useful when tracking down memory leaks.
The Performance Profile Bottom Panel
The above-mentioned panels give you an overview of the app’s runtime. It allows you to “get a feeling” of where the bottlenecks are. Once you suspect a part to be at fault, you can drill down into the code itself and find not only the faulty function, but the exact line that causes the issue.
The Summary tab
The summary view has 2 modes.
The first is a summary of a whole recording or a certain zoomed range (Figure 8).

Figure 8 shows the summary for the range 12.33s to 12.71s of an app’s recording. It shows you how much time was spent in the various lifecycles of the app.
What we can deduce here is that during this time range:
- The CPU was busy for 224ms parsing JS.
- An insignificant amount of time was spent on rendering and painting
- The rest of the recording the browser was idle.
The second summary view is valuable information about a segment (Figure 9).
 |
| Figure 9: A selected function in the flame chart (top) and its corresponding summary (bottom). Red arrows mark areas of interest. |
In the flame chart shown in Figure 9 a function render is selected (top red arrow). The summary part (bottom) shows relevant information regarding the render method (bottom red arrow). See that it gives a specific line in the code – clicking the link (highlighted in yellow marker) will get us to the line of code in the Source panel of the dev tools.
The following other tabs in the bottom section will show you a list of all the functions that ran during the recording or selected time range.
Bottom up
This view allows us to see functions and their callees (Figure 10).
This view can be sorted by self time or total time. Self time is the time that the function itself took to run. Total time is the time it took the function we chose as well as its children to complete. We will usually look for high self time functions.
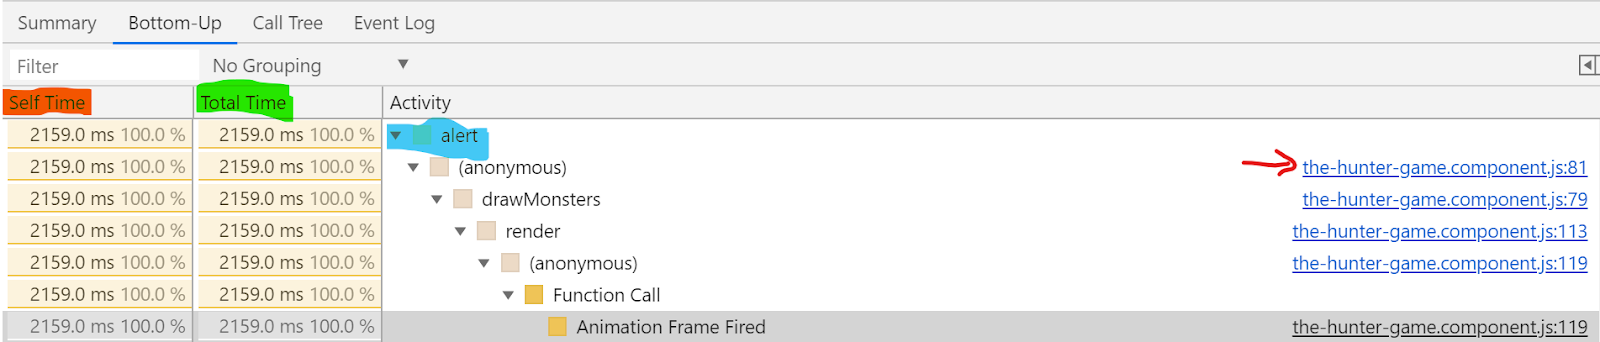 |
| Figure 10: The Bottom-Up view. Self time is marked with orange, total time is marked with green. |
The “alert” function (marked with light blue) took around 2 seconds. We can drill down to see what function called it. Its parent is anonymous, and we can click a link (red arrow) to see where it was called in our code.
Call Tree
Like the bottom-up view, you can sort this section by self and total time. The difference between Call Tree and Bottom Up is that in Call Tree you get to see the top level functions, and you drill down to see the children.
This way, you can track functions that had long total time, and then look for the children with long self time to track the performance issue.
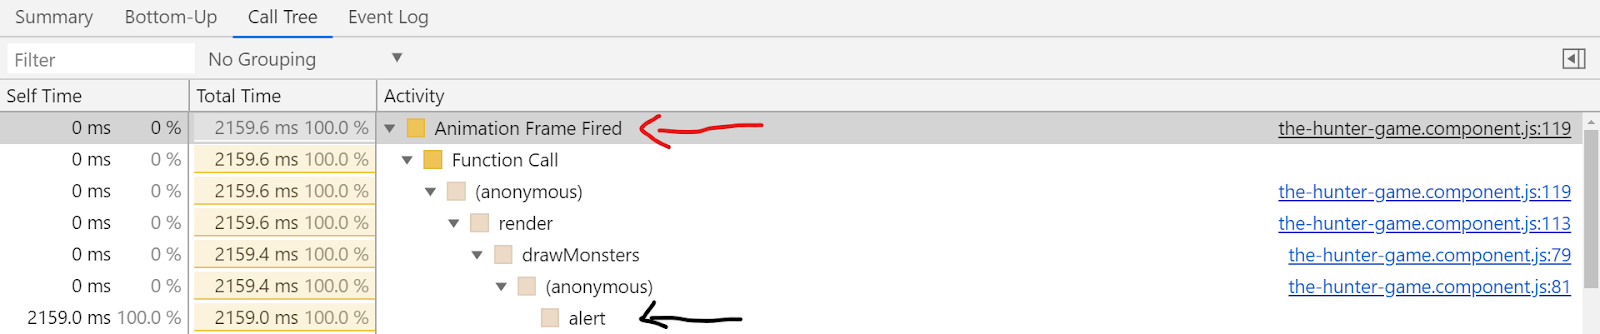 |
| Figure 11: The Call Tree view. |
Figure 11 illustrates such a case.
We found a function with a long Total Time and 0 self time (marked with the red arrow). We unravel the tree until we get to the alert which took a self time of 2 seconds.
Events log
As its name implies – it shows a chronological list of the functions that ran in the current zoom:
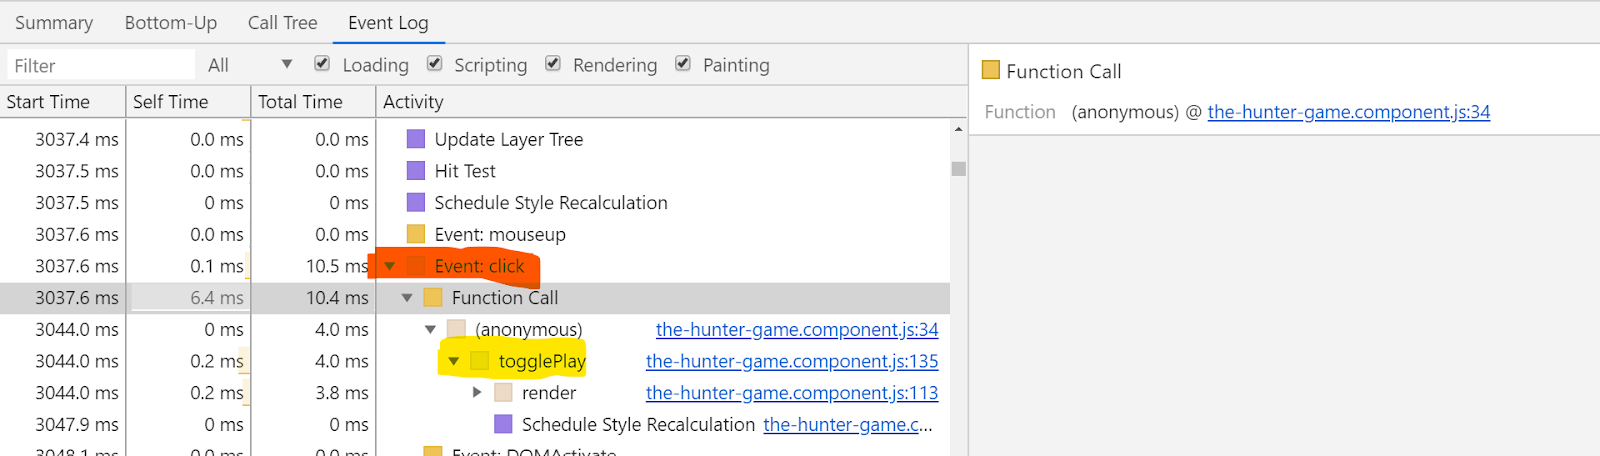 |
| Figure 12: The Event Log. |
In Figure 12 the click event (marked with orange) initiated a process that resulted in togglePlay (marked with yellow). You can keep tracking the whole chronological flow of the click event.
Summary
These are the essentials of performance profiling of a frontend Javascript Application. I personally use them daily – both at work and when I contribute to open source projects.
Many of the posts in this blog show results of performance profiling to show problems and solutions of performance issues.