

Debugging is an important skill for every developer. Here’s how to quickly setup debugging for nodejs with free tools everyone has.
Table of Contents
Introduction
There are many fancy tools for debugging your application. Data dog, rookout, aspecto and sentry to name a few. They are all commercial solutions though. They cost money, and have their learning curve for new developers coming into the team.
There is a tool that almost every computer in the world has that can give you debugging and profiling capabilities for your nodejs applications: chrome dev tools.
Logs debugging
When it comes to debugging nodejs applications, the first tool that comes to mind is the almighty `console.log`.
You just sprinkle your codebase with console.log s in the right places, spin up your nodejs server and see the values of your objects at any given time.
But that’s a primitive way of debugging. More like logs reading… And what about profiling your application and checking memory usage and cpu consumption?
How to really debug a nodejs application?
With Chrome dev tools it’s very easy.
Let’s demo that. For this demo I’ll be using this repository: https://github.com/YonatanKra/nodejs-perf-demo
1. You can clone it and try along (don’t forget to yarn or npm install after you clone it).
2. We start the application with the --inspect flag:
node --inspect gc/gc-example.js
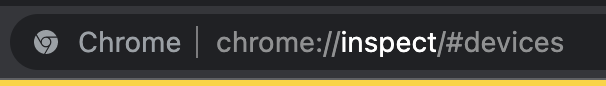
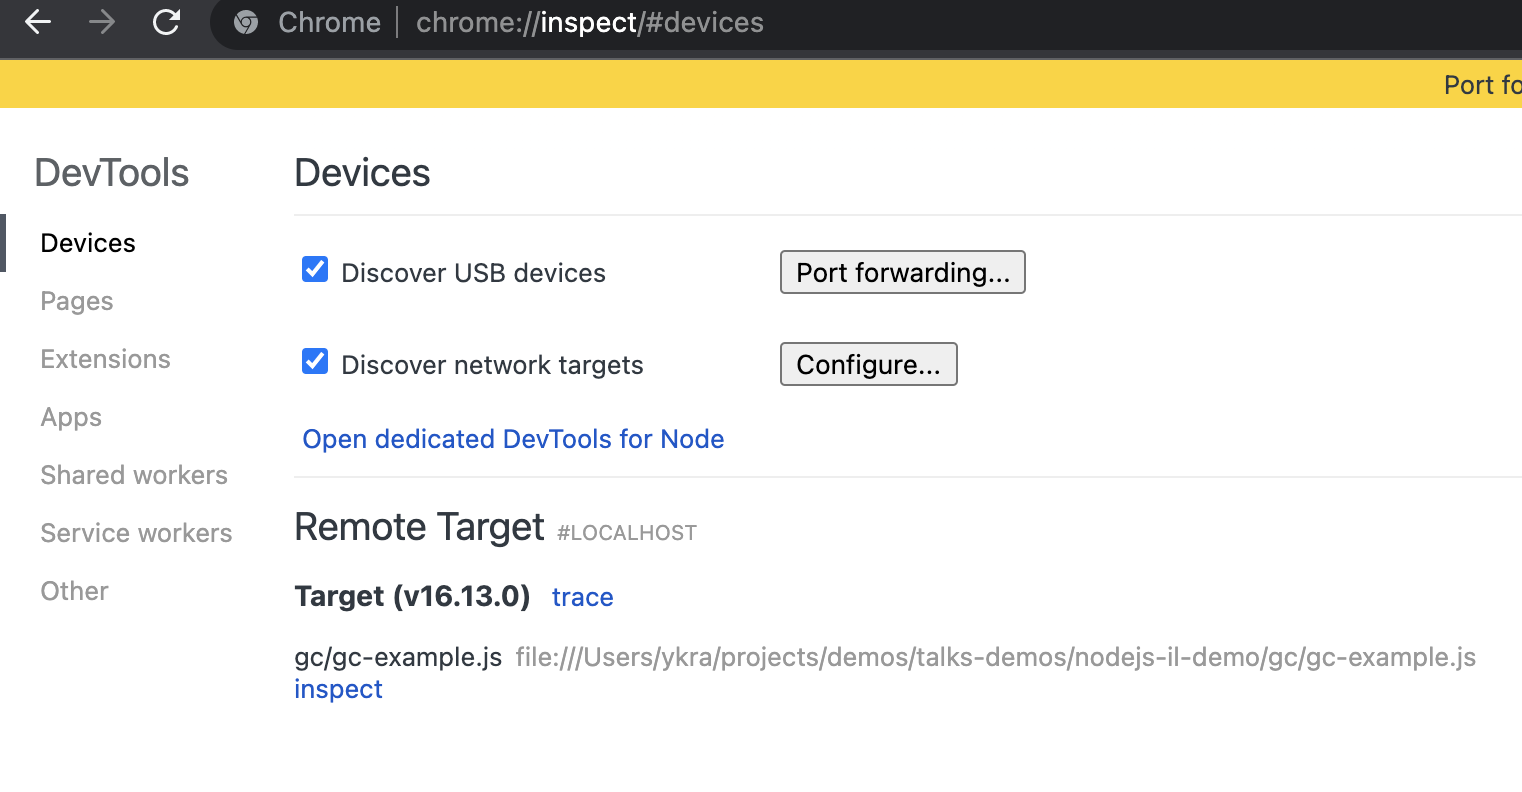
3. We head over to chrome and browse to chrome://inspect:
4. Inside, we should see our server running (see the Target section in the image below).
5. Click the inspect link under the running process’s name and you should get to the nodejs chrome dev tools:
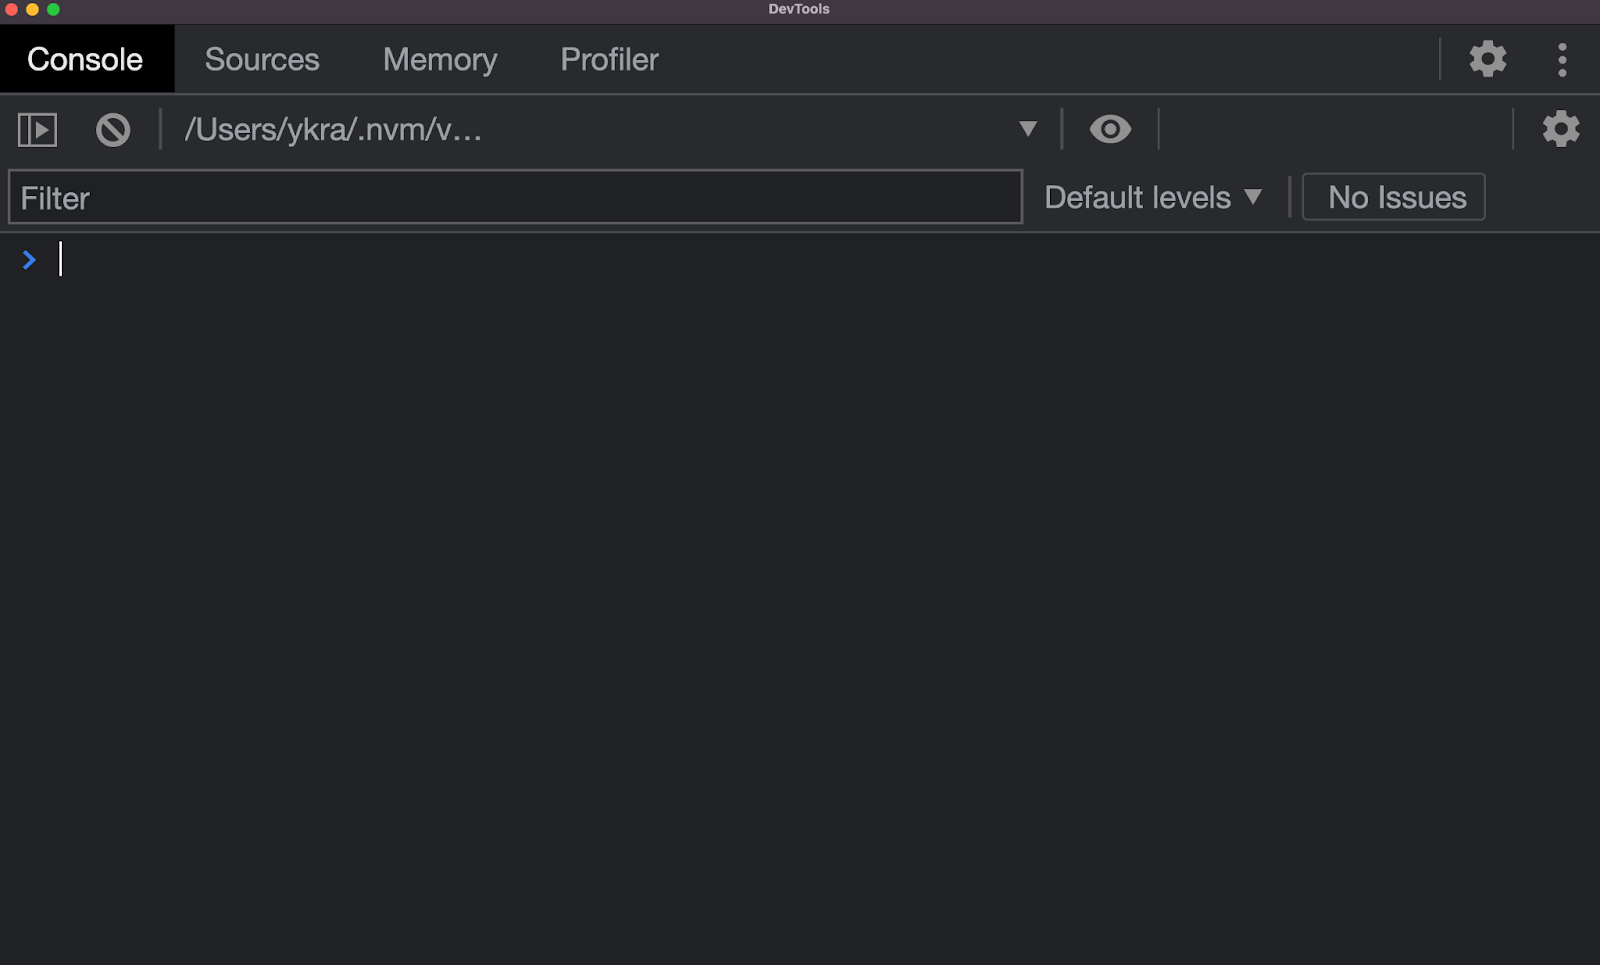
Once there, you can use the nodejs console, see the source files and add debug points, and profile the app’s memory or CPU usage.
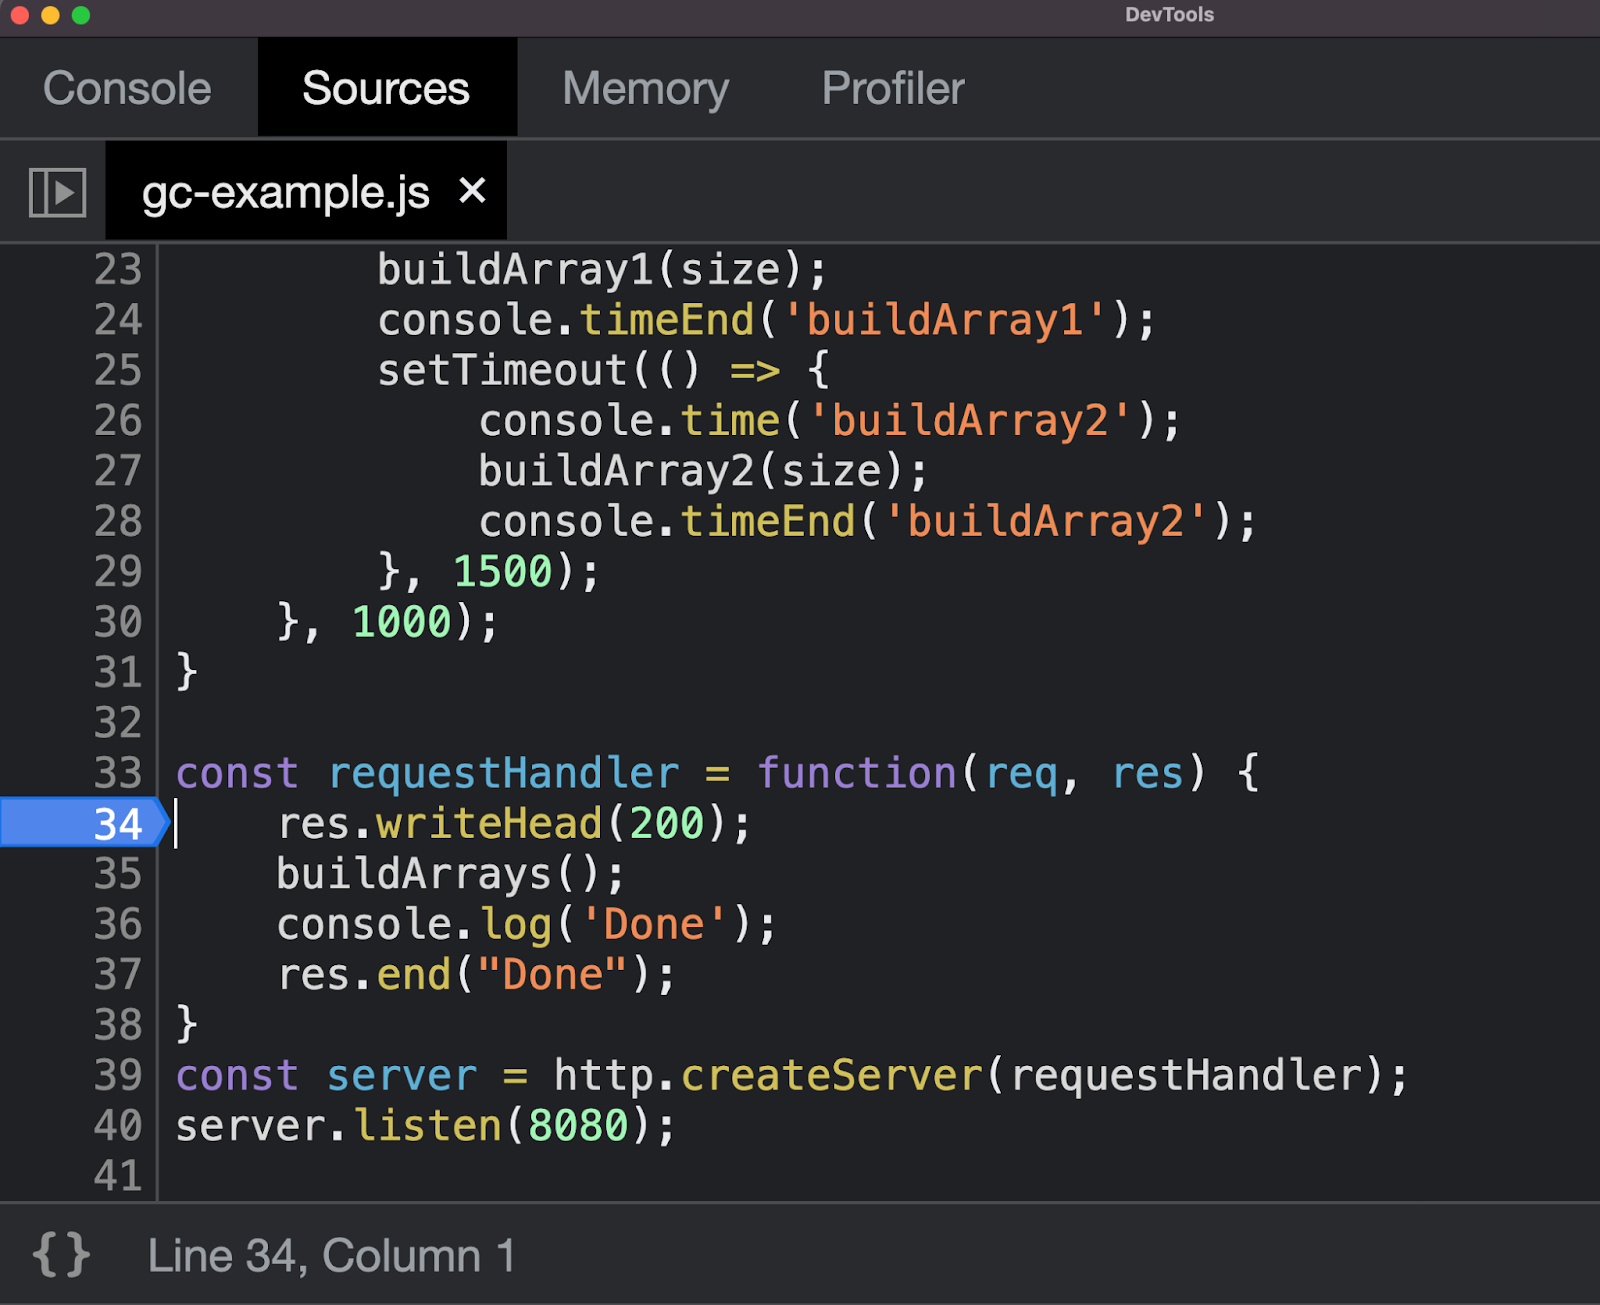
How to add a debug point to a nodejs application?
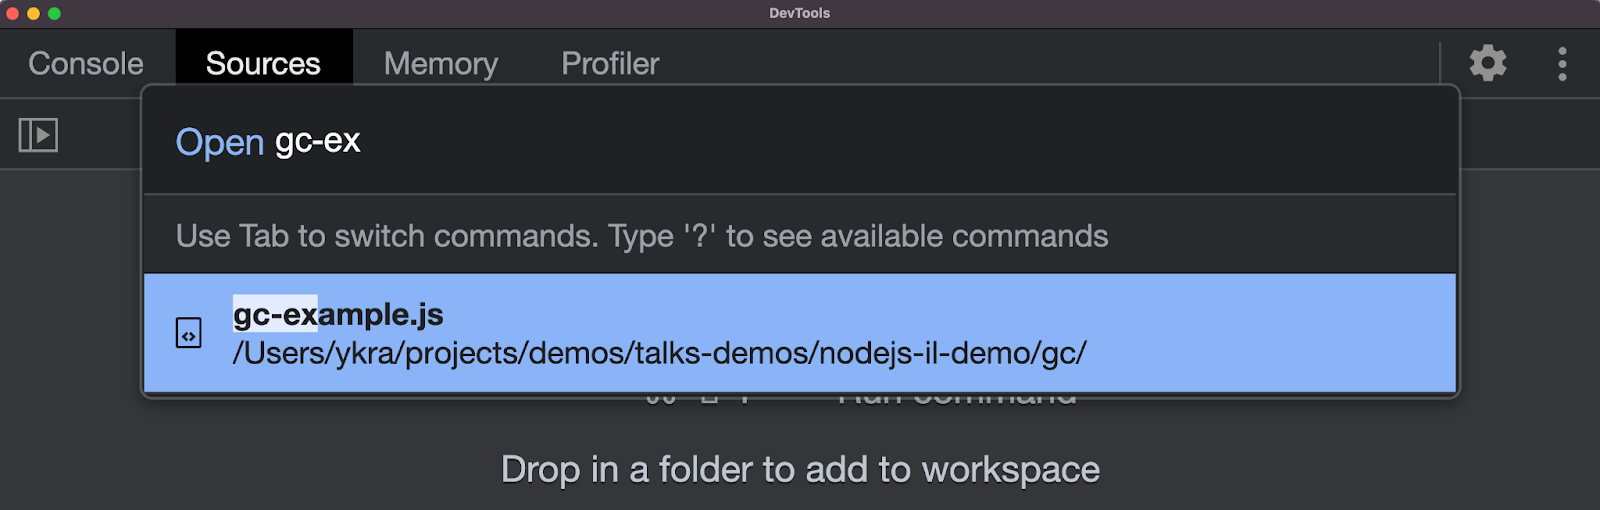
We head over to the Sources tab and hit Ctrl+P (or cmnd + p on Mac). This will allow you to search for your file. In my case, I’ll search for gc-example.js:
After I open the file, I just set a debug point wherever I want. In this case, I’ll add it to the API entry point:
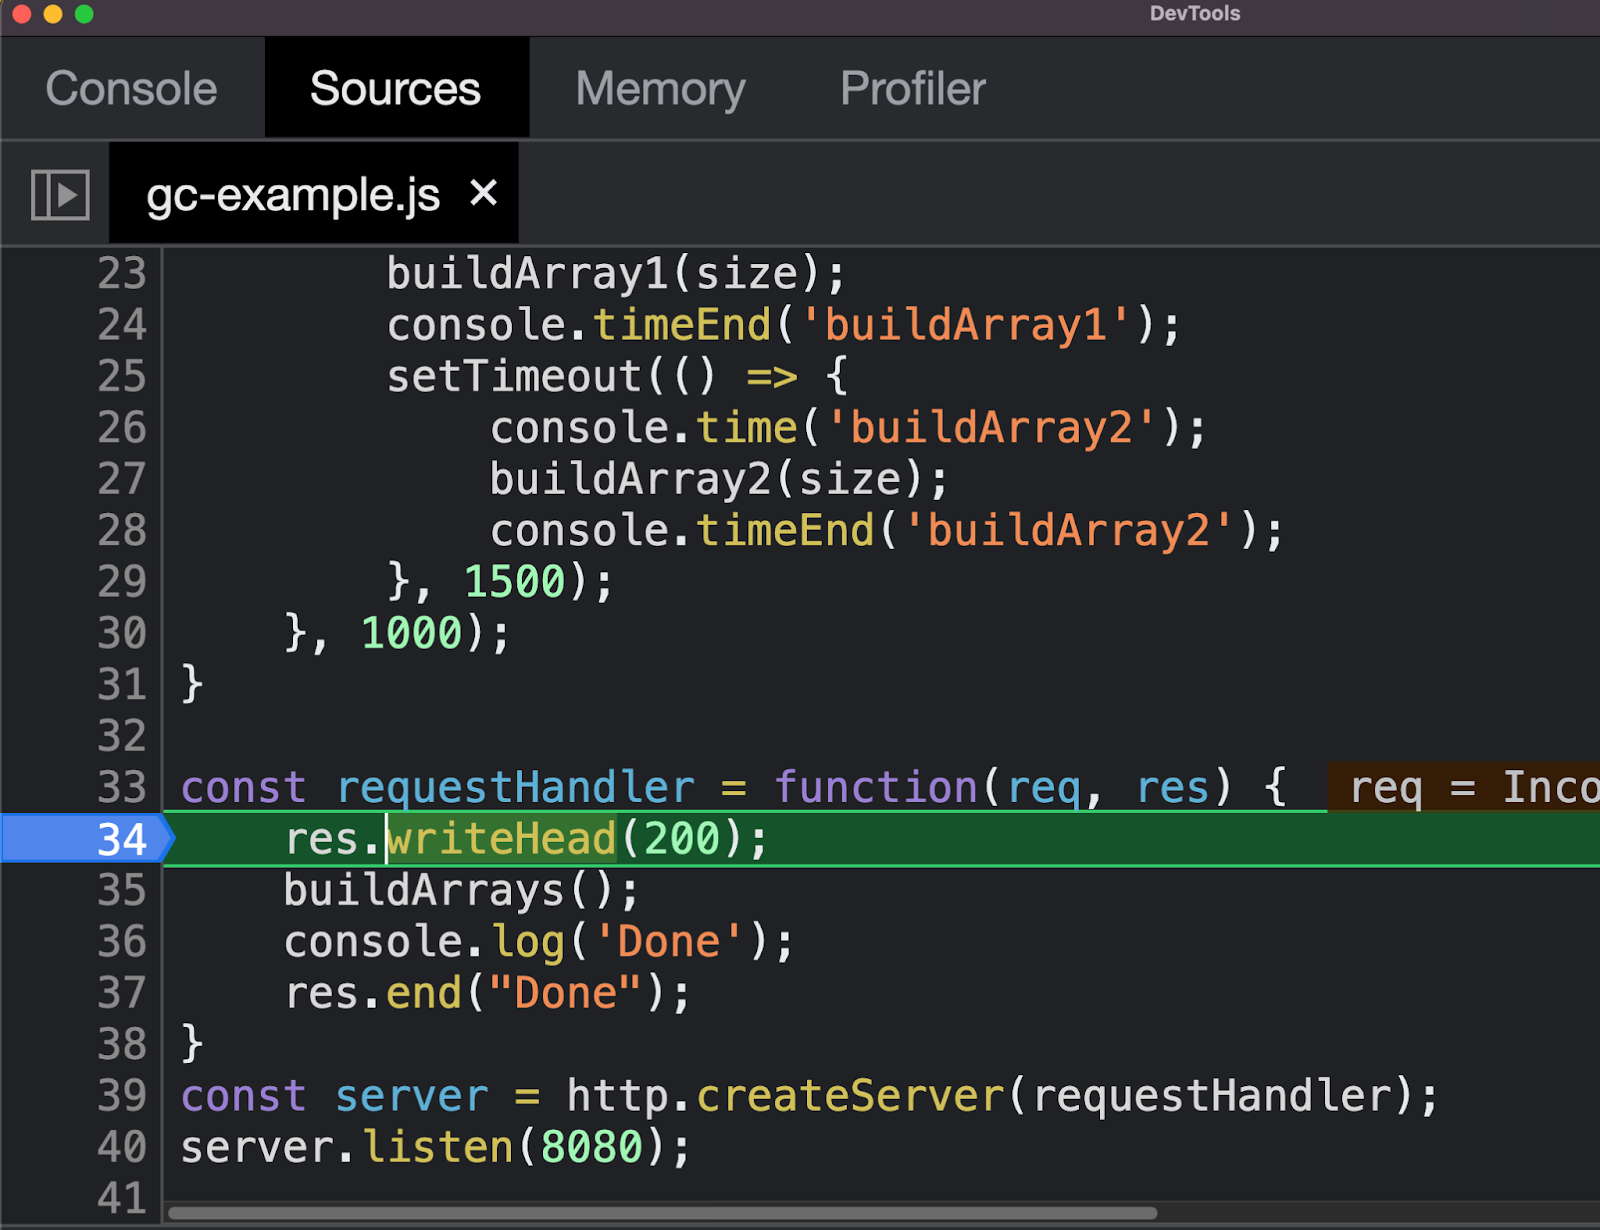
Because in my case, the server is running locally on port 8080, I can trigger my API using curl like this:
curl localhost:8080
Because our server is serving using the GET method, we could have reached the same effect by browsing to this URL. Sometimes you have a POST gateway to test, so you’d have to use curl or tools like postman.
Triggering the API will result in the code stopping at the breakpoint:
How to profile the CPU usage of a nodejs application?
For this part, we’ll head over to the Profiler tab:
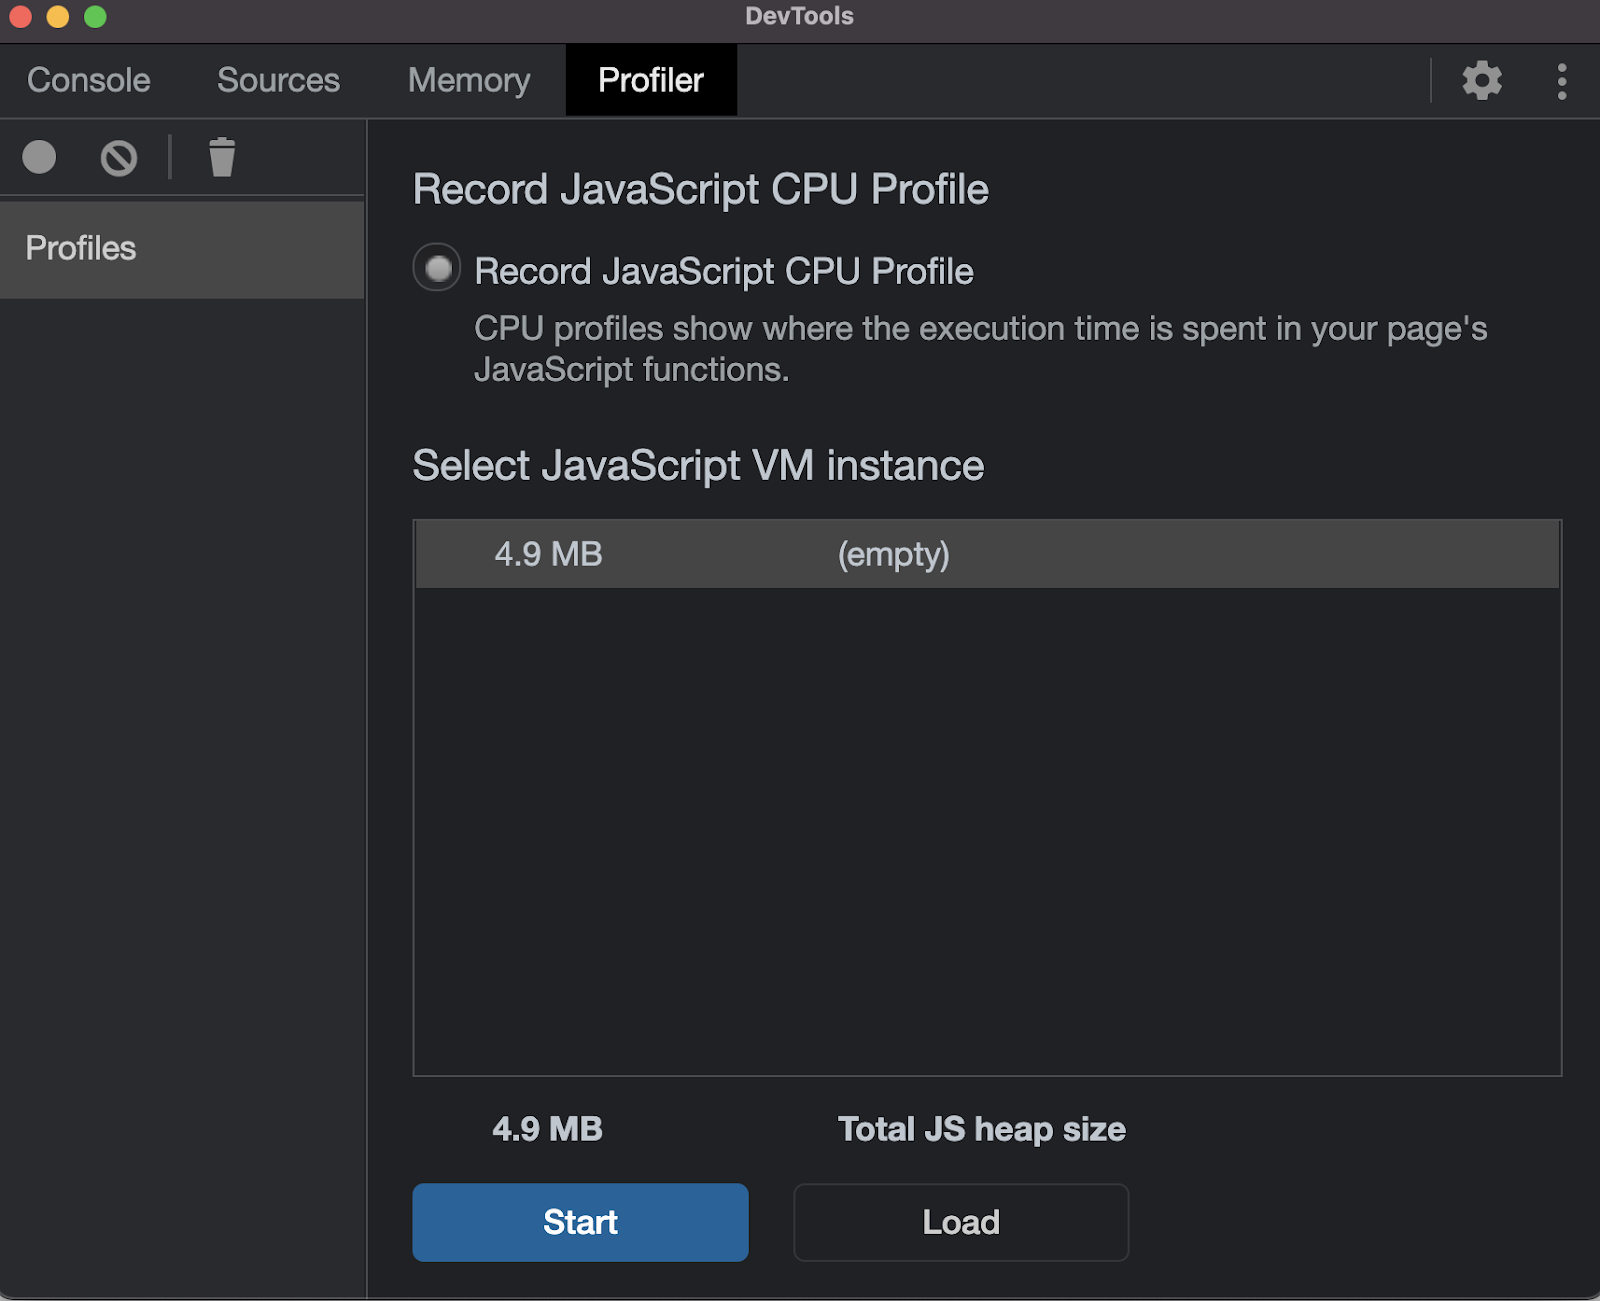
We can click on the “Start” button or the small record button at the top left part and it will start recording our application.
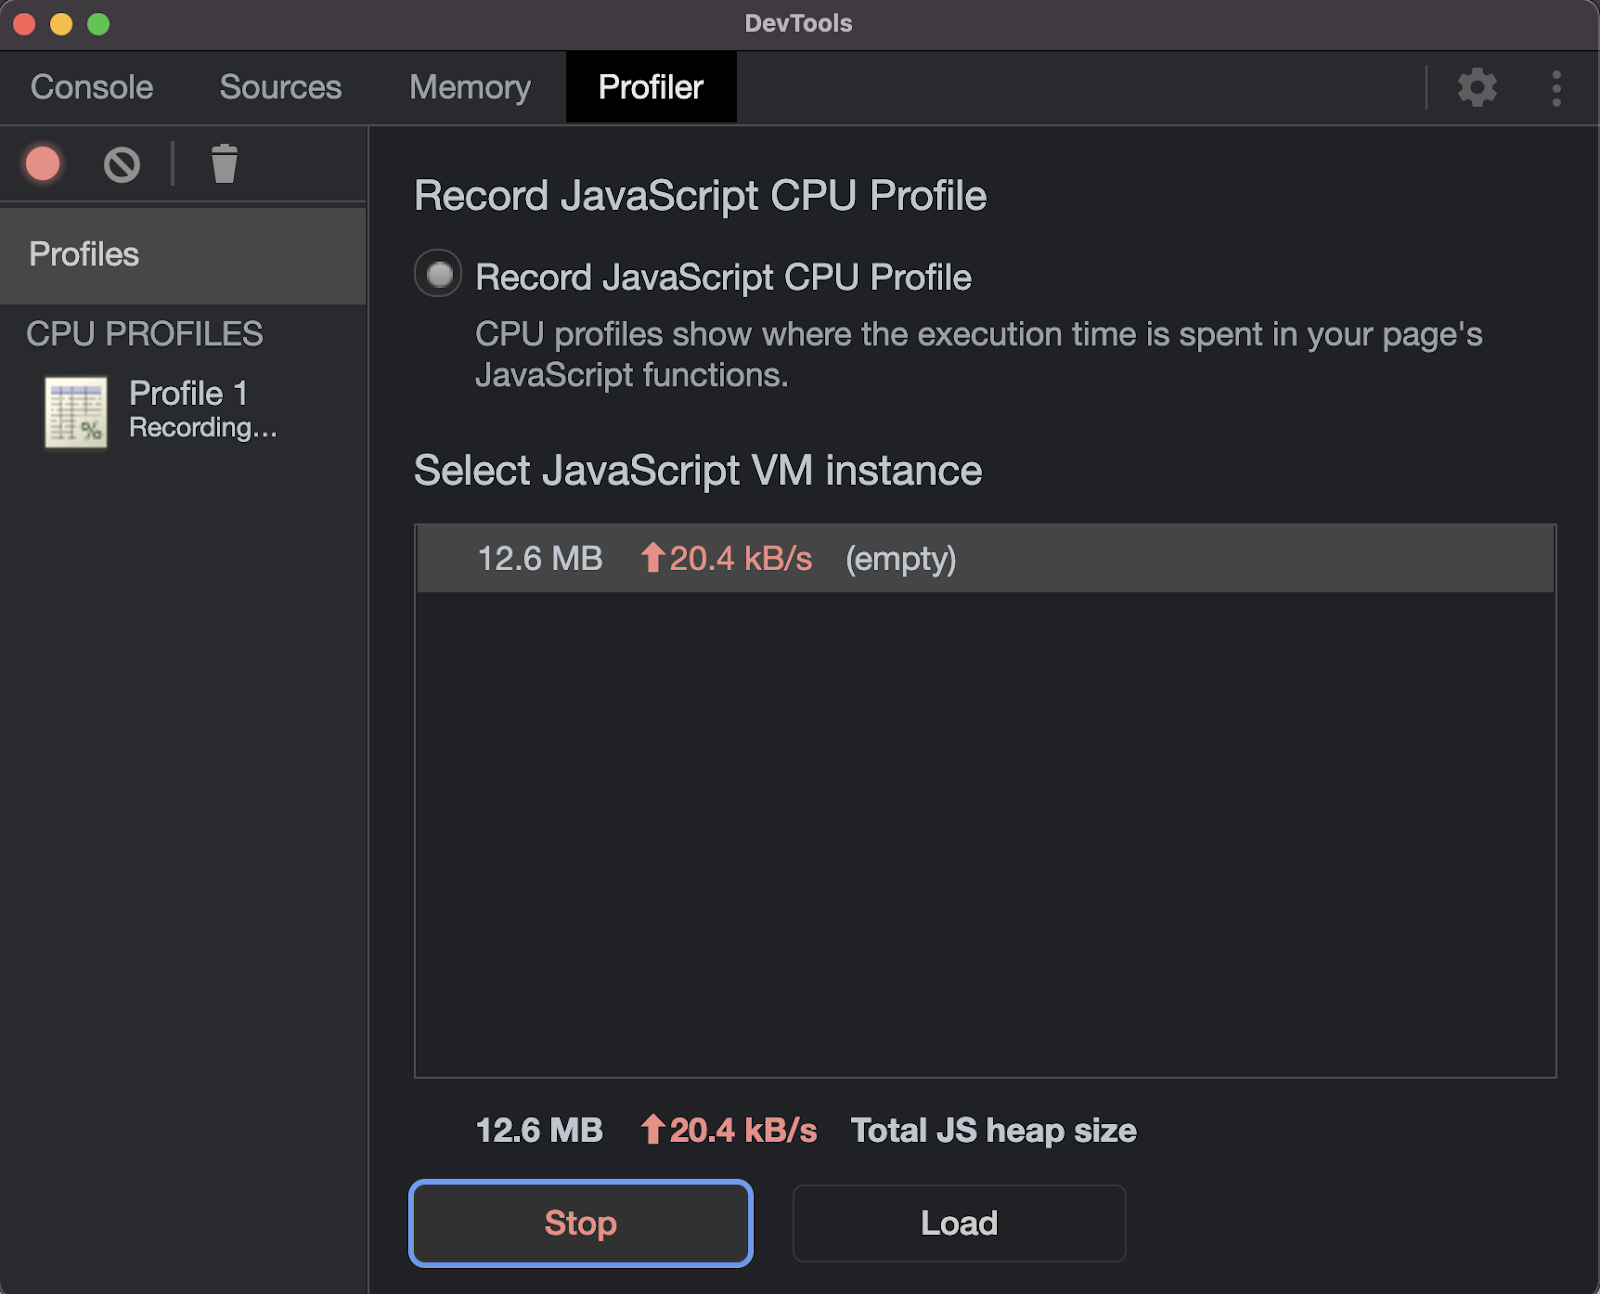
We will use the curl trick from above to trigger the code of our application and then click on the record button again or on the Stop button that replaced the start button:
Once we stop the recording, we will get to a flame chart of the recording:

A record item, named “Profile 1”, is created. If we record again, we’d have more than one recording and we can browse them using the left CPU profiles menu.
You can zoom in and see exactly what functions ran, how long it took every function to run, garbage collection instances etc.:
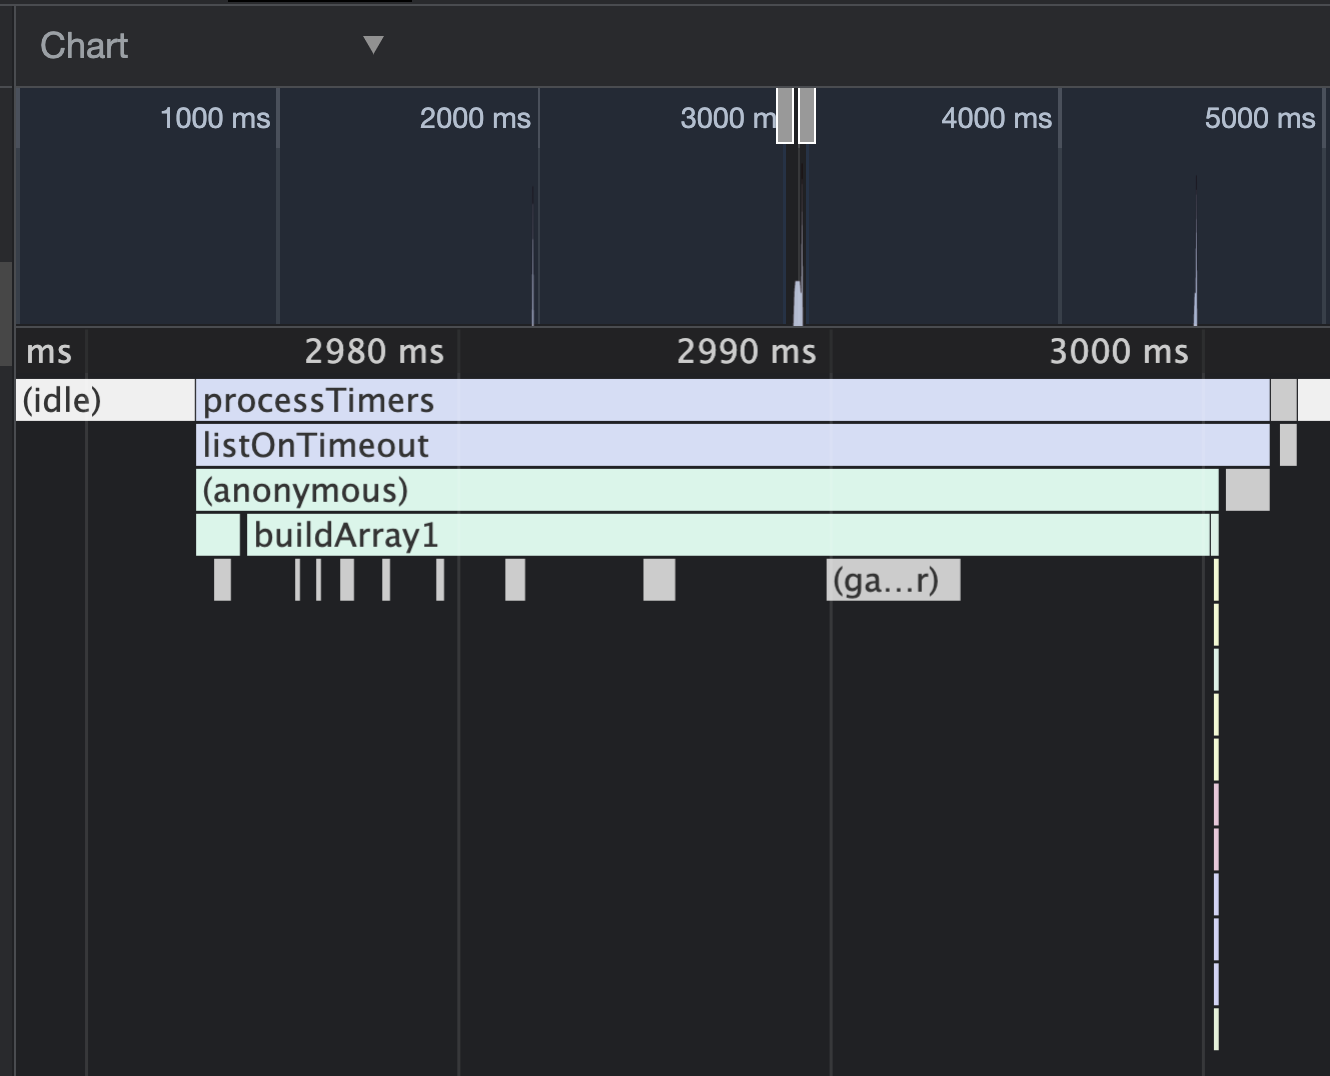
buildArray1.There’s much more information but that’s beyond the scope of this article.
How to profile the memory of a nodejs application?
Now we head over to the memory tab:
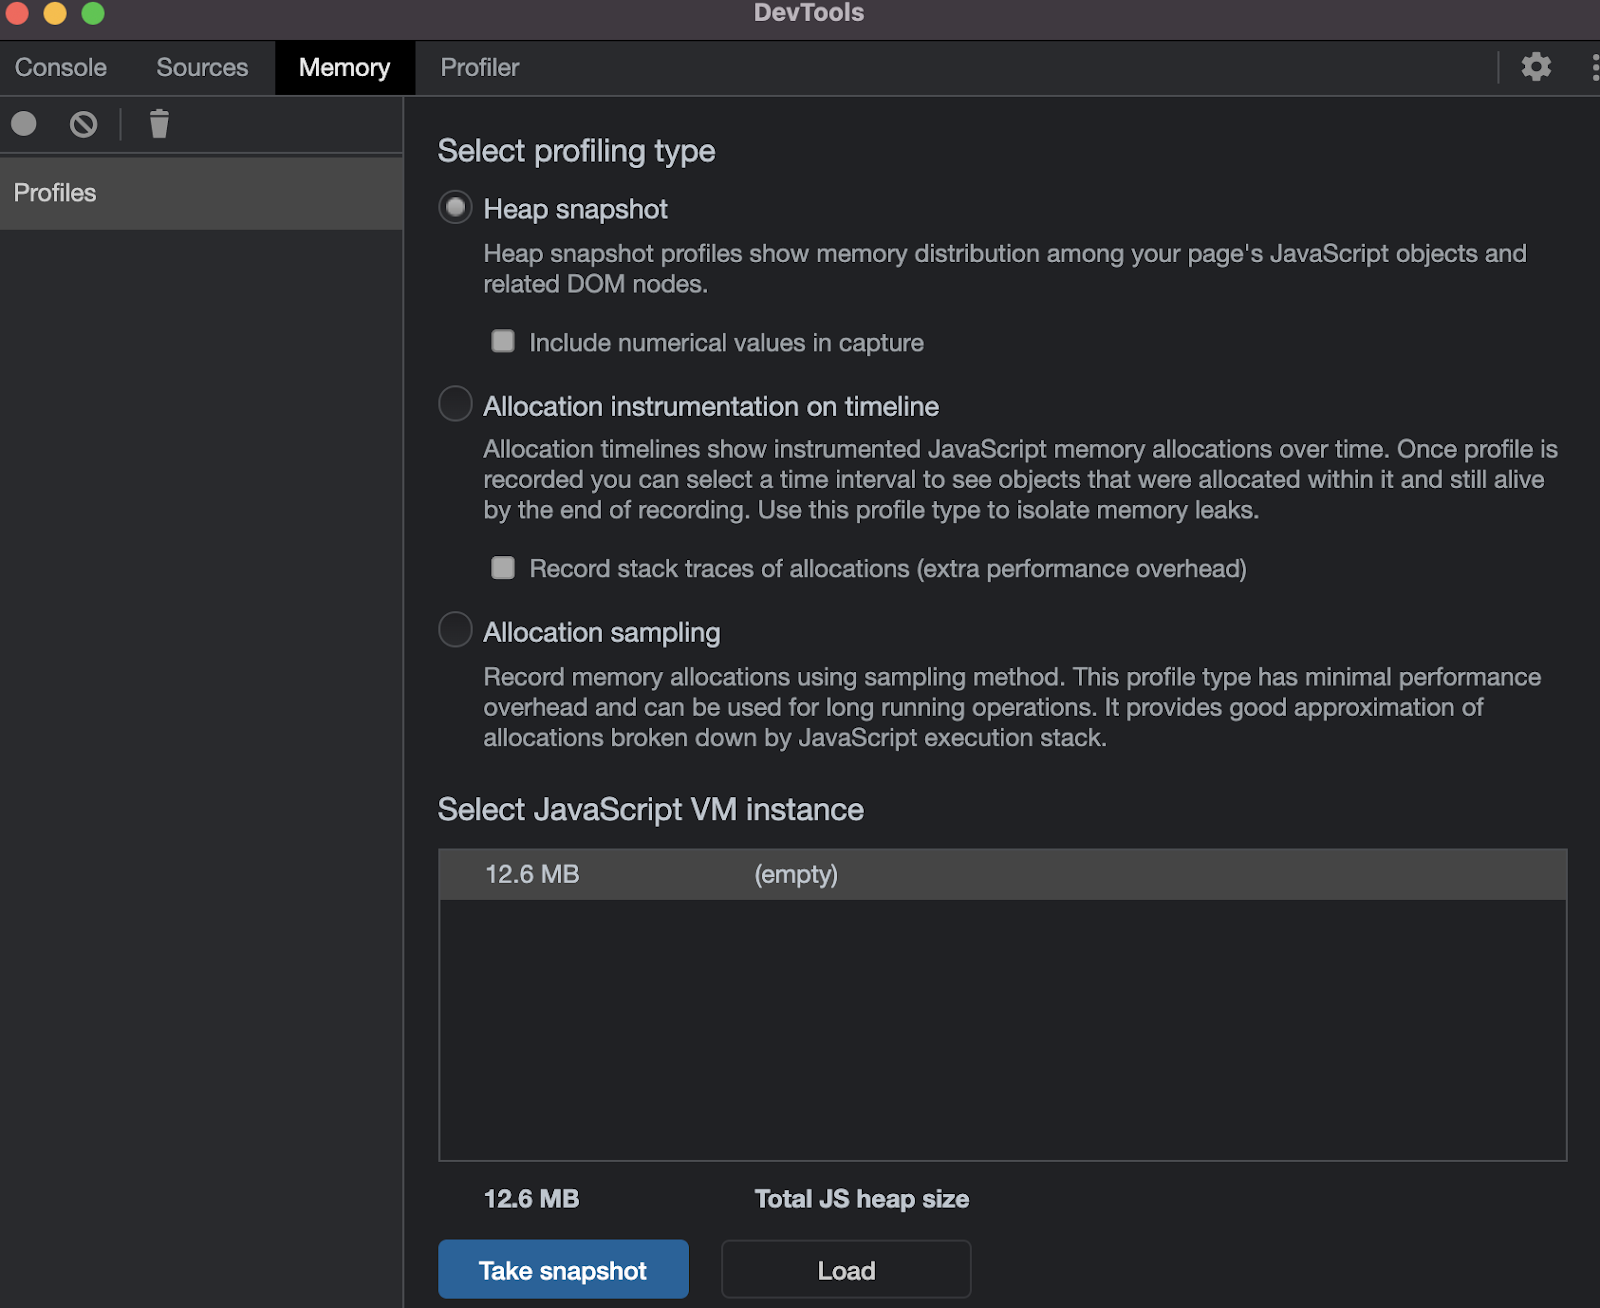
Explaining about it is a bit out of the scope of this article, but you can take a heap snapshot (what objects live in your app’s memory), track allocation of memory in your app and even what applications allocated how much memory.
With all of these tools you can easily solve memory issues – the most (in)famous of them is the dreadful memory leak. You can dig a bit deeper with this video.
How to debug multiple applications?
The --inspect flag opens the debugging connection on 127.0.0.1:9229 as default. Trying to run two debugging instances will result in an error:

How to solve “address already in use” error when debugging nodejs?
In order to solve this, you can set the url and port when starting your debug session like this:
node --inspect=127.0.0.1:9230
Doing that, will not show your app in the chrome://inspect page automatically. There’s another step you need to do in order to make this work.
In the chrome://inspect page there’s a link to open the nodejs dedicated devtools:
This will open the dedicated devtools where you will have a Connection page:
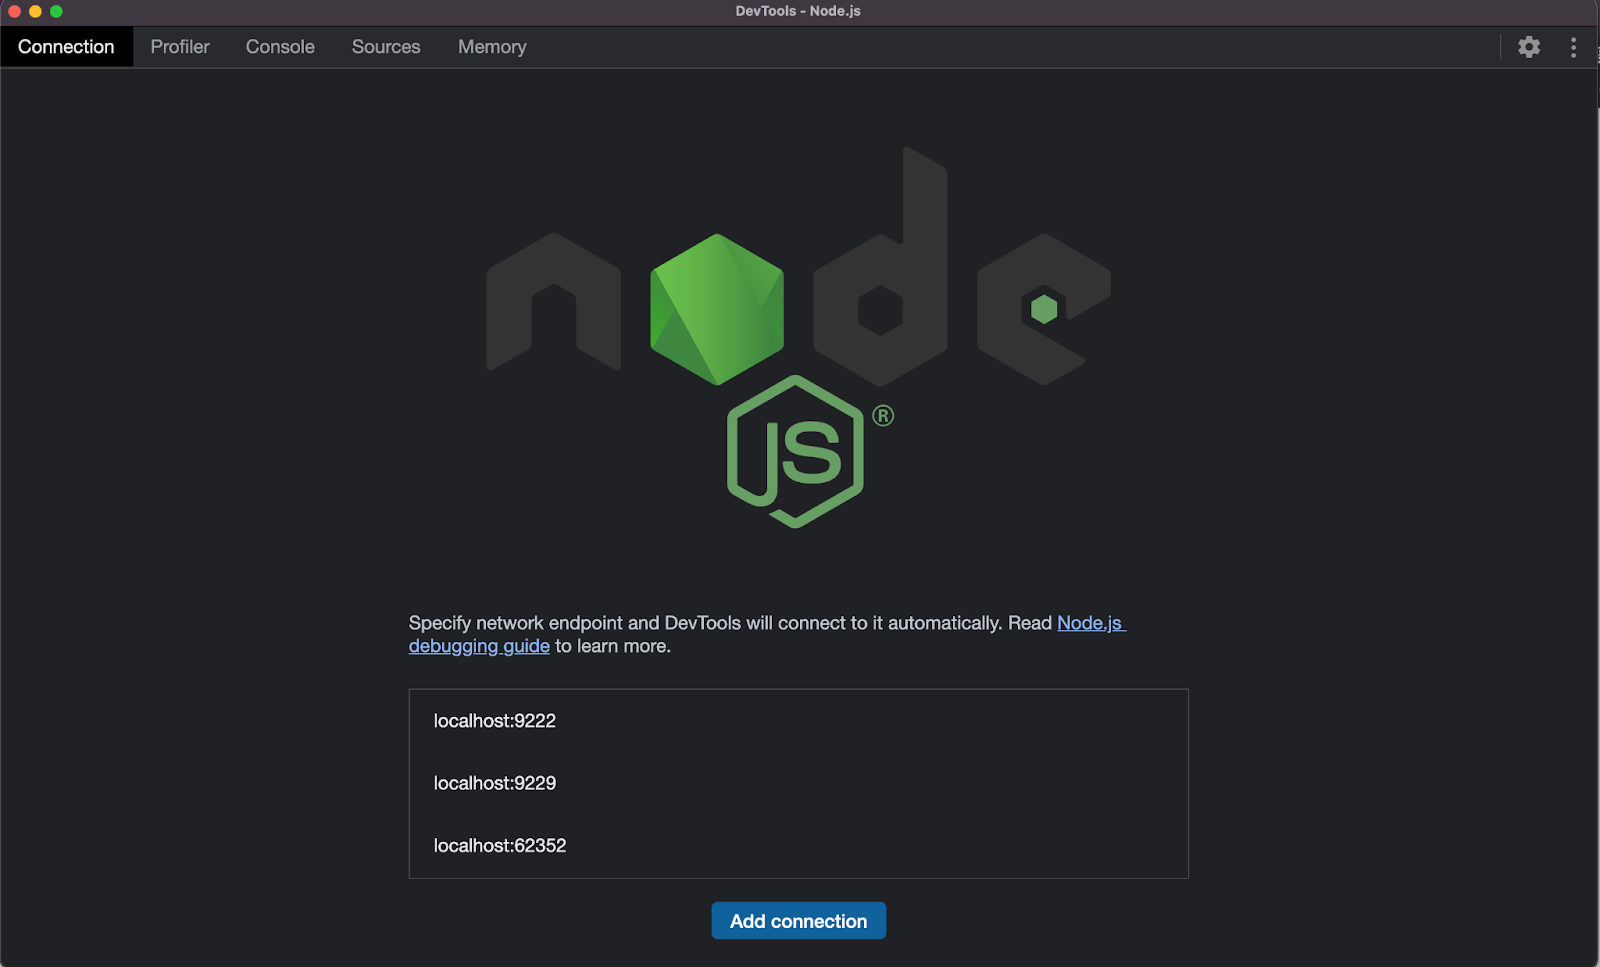
Just click the “Add connection” button and add your debug url and port (the one you set when running the --inspect=<yourDebugUrl>:<port>).
How to debug and profile a nodejs app remotely?
All this is nice, and we can debug and profile the application when it is running locally. How about remotely?
In order for an app to be exposed to the world, you should expose it in the url 0.0.0.0:<port>.
Serving your app through 0.0.0.0 exposes your server to everyone. This is highly insecure and blocked by most cloud vendors by default (and probably your devops team will object to that as well).
In order to get over this obstacle, you can leave the debug URL local (e.g. 127.0.0.1:<port>) like this:
node --inspect=localhost:9230
and access the server via SSH tunnel like this:
ssh -L 9221:localhost:9230 [email protected]
You would usually be prompted for a password or use a key file (pem) in order to access the machine, but your computer will have access to the machine’s localhost just as if you debug it locally.
Chrome dev tools have localhost:9221 set up by default. If you are using a different port, just set it up in the connection page.
Summary
Debugging is a necessary phase in the development process. No matter how many tests you write, and how many years of experience you have – solving a bug will require a kind of debugging (I usually debug the code when running the tests).
Using the knowledge in this article, you can now debug nodejs applications using chrome dev tools. More than that – you can profile your applications and solve performance issues. If you want to read more about profiling JS applications click here. You can browse the performance category to see more related articles.
Remote debugging is rarely needed in my experience, but chrome dev tools allows you that as well by connecting to remote servers via the Connection tab.
Thanks a lot to Yuval Bar Levi and Miki Ezra Stanger the kind and thorough review!